It’s never too late to learn new things
10/05/2021
Introduction
Part of my MSc in Occupational Psychology required spending 60 hours in work experience for the Applying Psychology to Work and Organisations module. Since I was doing this degree full-time and do not currently have a job to relate the experience to, I was offered a series of projects and chose a data analysis one that had not been looked at. Due to Covid19 restrictions, the whole process was conducted remotely. I had always assumed spending 10 hours per week on this project (a ‘normal’ working day, right?); and once I had met the client on Teams, we arranged weekly meetings to monitor progress and exchange information.
The job
I had, perhaps naively, expected pages of numerical data, thinking I could run various quantitative statistical analyses to present my findings. Imagine my surprise when I received an Excel file with columns of text! Not to worry though, I enjoy both quantitative and qualitative research/data. The client graciously explained the purpose and reasoning behind the data; and we discussed what the expected outcomes should be. Their intention was to potentially improve procedures in how they write, collect and review feedback on outcomes of learning. This was a new learning curve for me in comprehending this discipline, as my previous professional background was technical/electrical field work.
Procedure
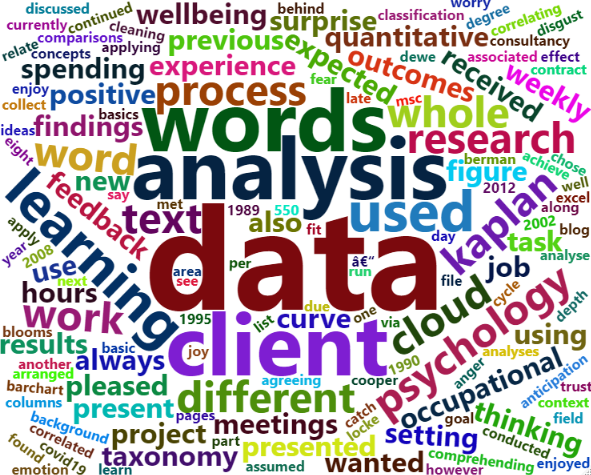
In the previous year I had learned the basics of R-programming with RStudio and thought I would incorporate this learning for the task, using RMarkdown to present the findings. This was my next learning curve as I had to research different techniques to apply for what I wanted to achieve. After ‘cleaning’ the data in order to analyse it, I found some useful text-mining functions to use, which I manipulated to fit the data. Frequently used words in the data were presented in bar-chart; and more commonly, word cloud formats (see Figure 1).

Figure 1. Example word cloud of this blog.
Then the frequently used words were correlated with associated words in the data to show context. A sentiment analysis showed how positive or negative the text was, along with an emotion classification using eight basic emotions (anger, fear, anticipation, trust, surprise, sadness, joy, and disgust).
The client was pleased with the results, however, during our weekly ‘catch-up’ meetings I was reminded of another area they wanted exploring. This included how their use of words correlated with Bloom’s Taxonomy; a hierarchical framework of words used for different levels of thinking – or rather, a sample list used by the client.
This particular analysis focused on word cloud comparisons between the ‘Taxonomy’ and the textual data. The results were interesting and were also presented as percentage tables, giving the client ideas for improving feedback. The whole project was received well; and the client was surprised at the depth of analysis; and also pleased with the different concepts used. Suffice to say, I enjoyed the whole process.
Relating the task to Occupational Psychology
Goal setting theory: to maintain motivation and a positive effect on performance (Locke & Latham, 1990, 2002).
The consultancy cycle: agreeing the ‘contract’, setting expectations, identifying, implementing and evaluating solutions.
Data analysis: Always a process in psychological research.
Wellbeing: maintaining my personal wellbeing (Dewe & Cooper, 2012), particularly engaging with natural surroundings (Berman et al., 2008; R. Kaplan & Kaplan, 1989; S. Kaplan, 1995)
